-
The Monitor
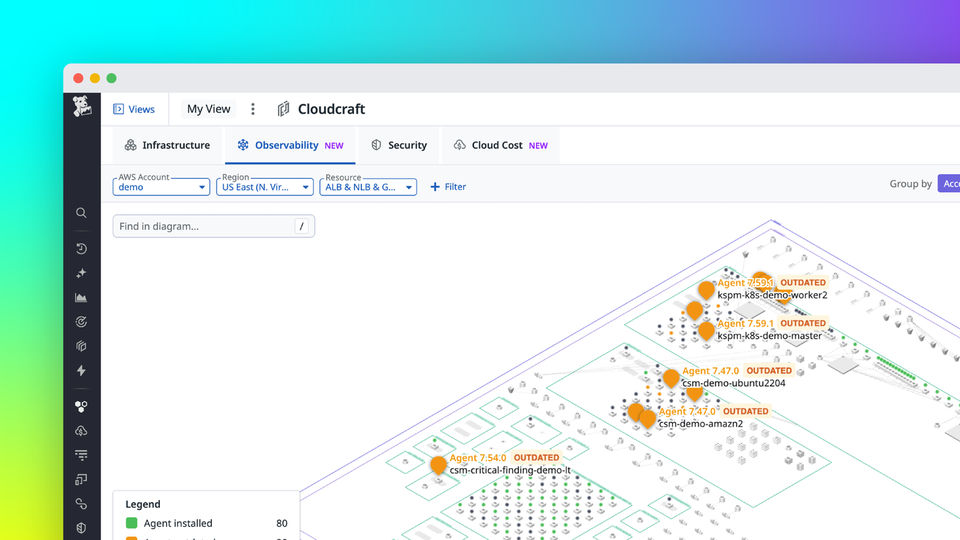
Visually identify observability gaps with Cloudcraft in Datadog (on The Monitor, Datadog’s blog)
Learn how the Observability overlay in Cloudcraft makes it easy to track observability coverage across your environment.
-
The Monitor
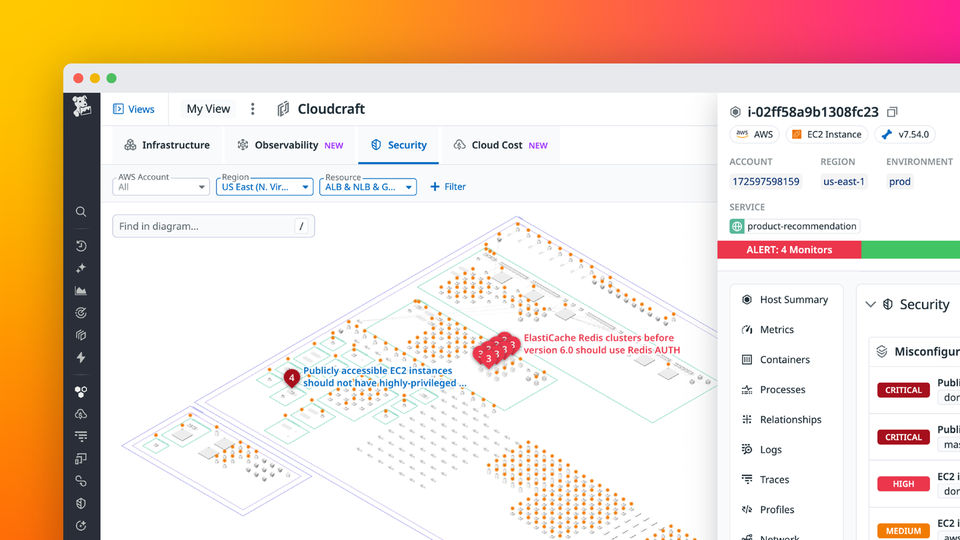
Visually identify and prioritize security risks using Cloudcraft (on The Monitor, Datadog’s blog)
Cloudcraft surfaces misconfigurations and other risks directly on a real-time diagram of your cloud infrastructure, so you can quickly identify issues and understand their context.
-
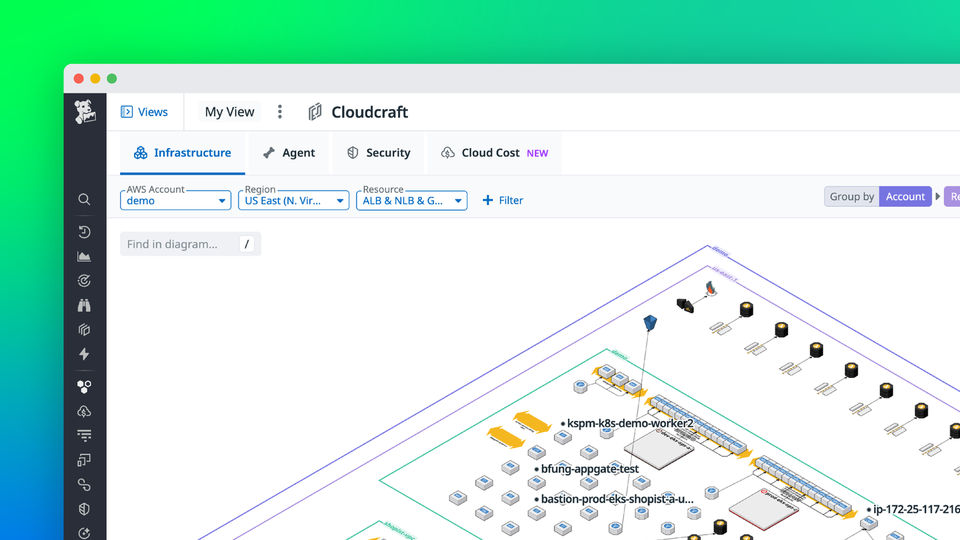
The Monitor
Create rich, up-to-date visualizations of your AWS infrastructure with Cloudcraft in Datadog (on The Monitor, Datadog’s blog)
Learn about a new Datadog platform feature that creates live interactive architecture diagrams available to all teams.
-
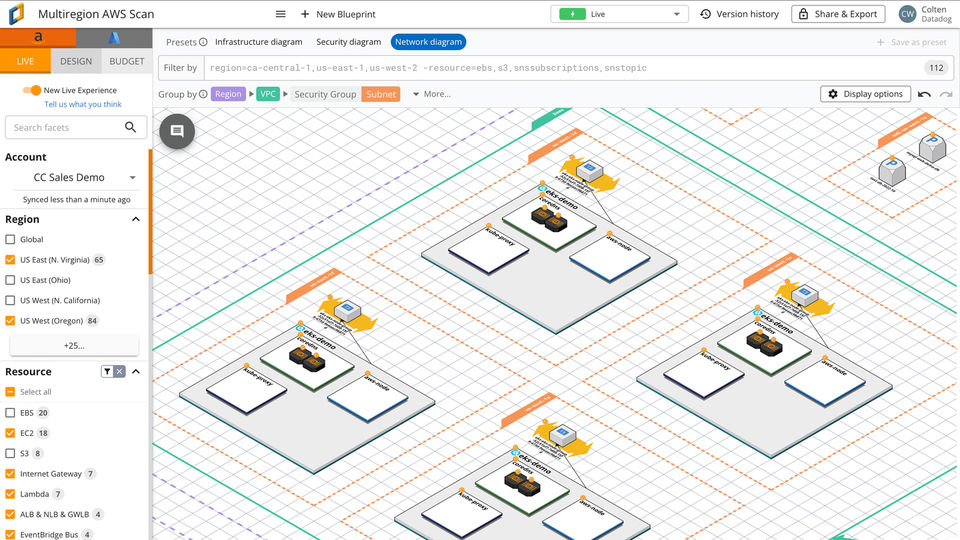
Release notes
Produce clear, easy-to-understand diagrams instantly with Cloudcraft’s new Live experience
Instantly visualize AWS and Azure infrastructure using Cloudcraft's new Live experience.


Turn your own cloud into a living map.
Connect your AWS, Azure, Google Cloud, Oracle Cloud, or on-prem environments and watch your architecture draw itself, included free with every Datadog subscription.
